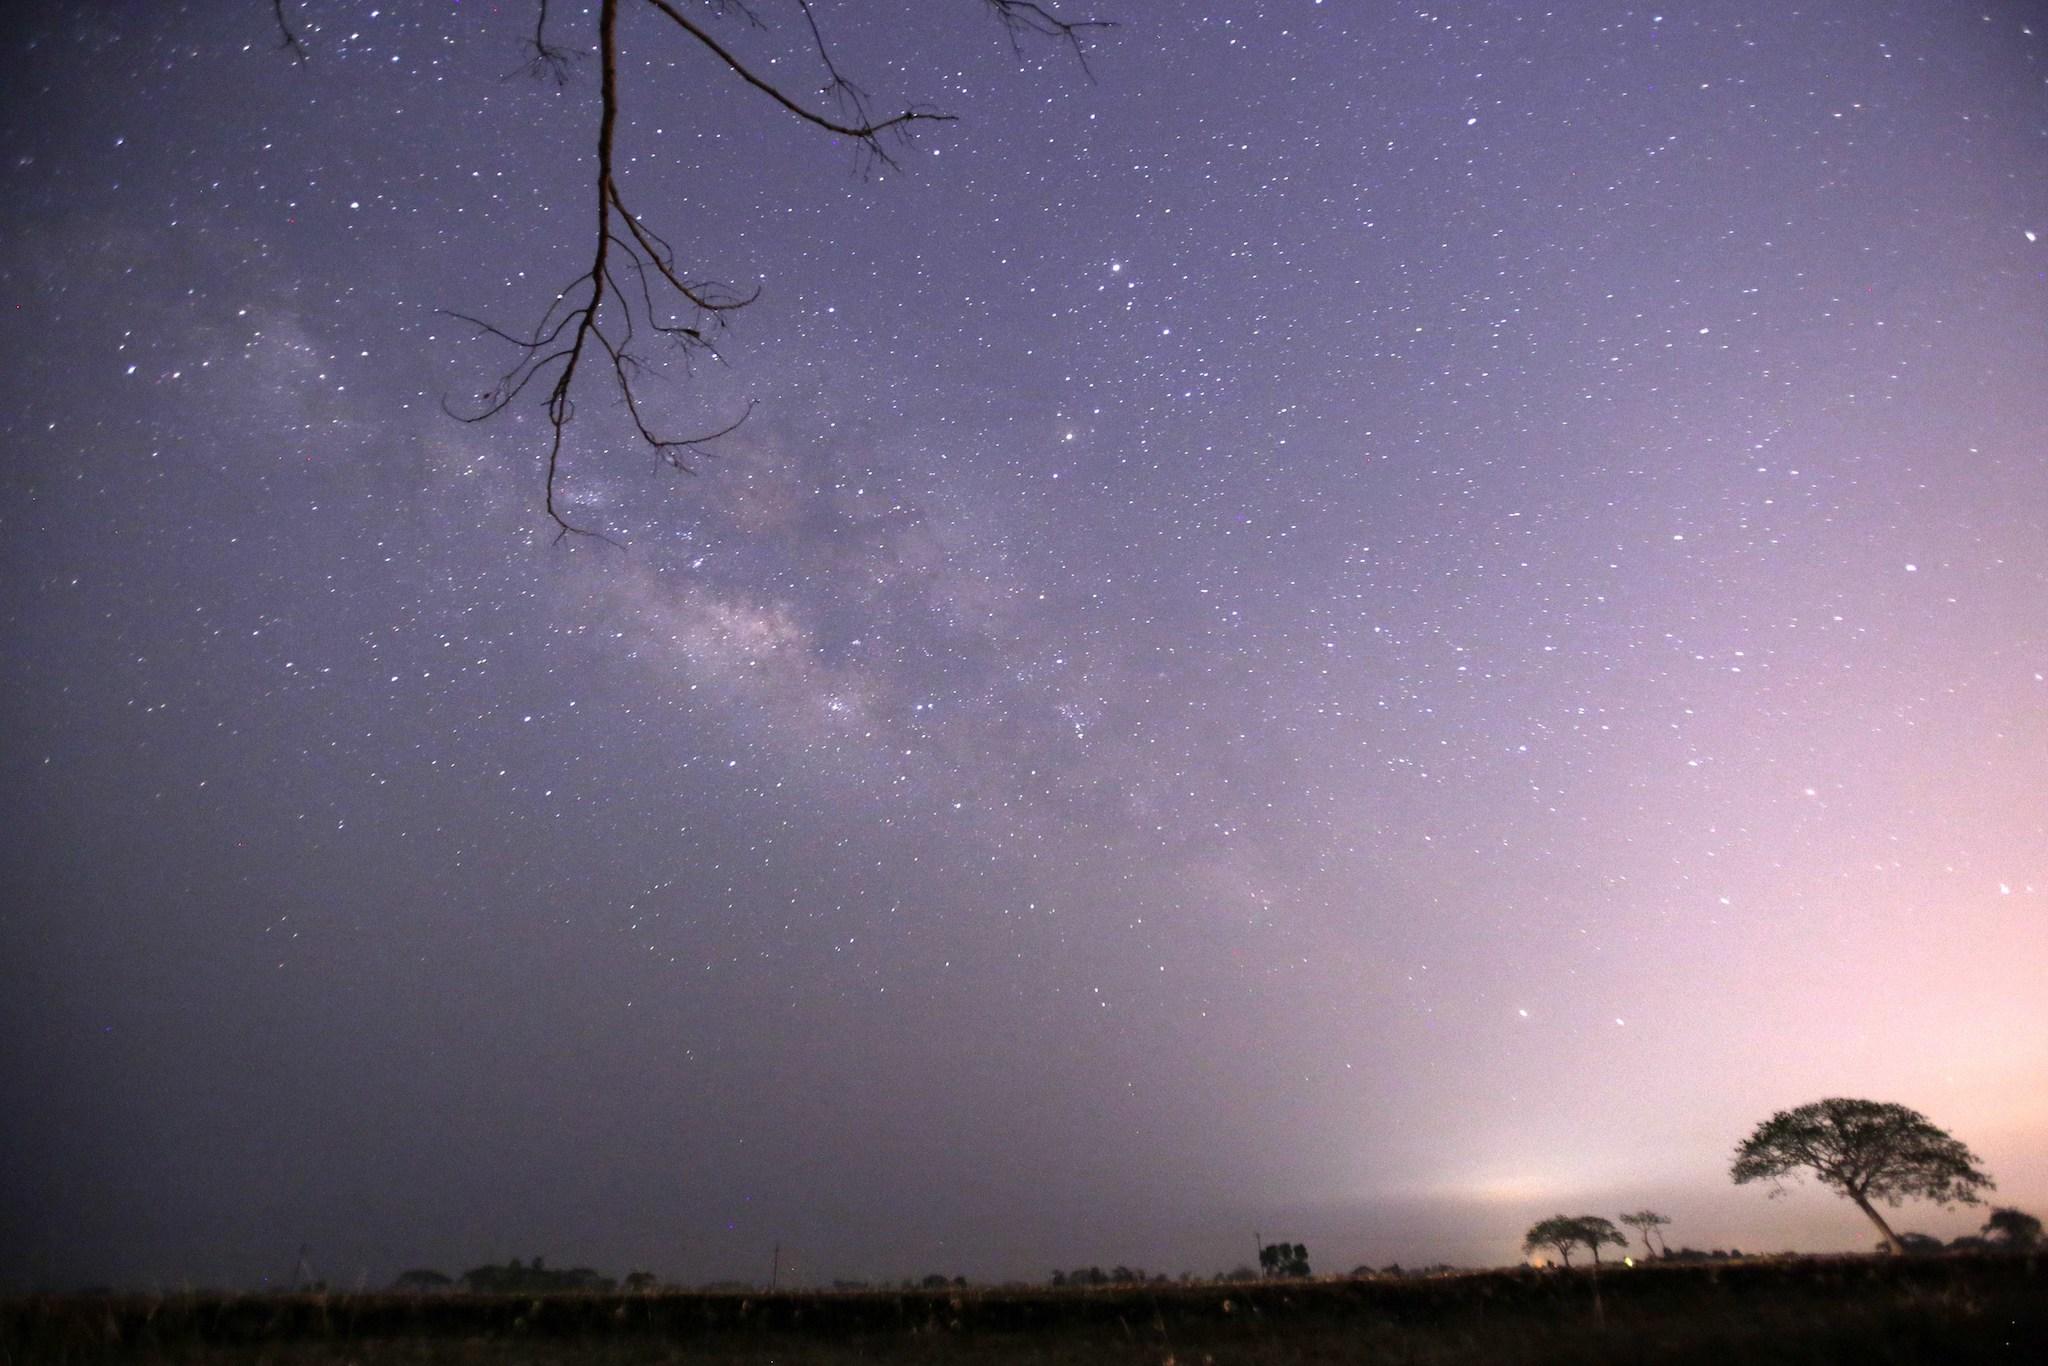
Scientists reveal the most detailed star chart of the Milky Way ever made
Map of our galactic neighbourhood has already unlocked some of its strangest mysteries

Scientists have published the most detailed chart of the stars in our galactic neighbourhood ever.
The data, released by the European Space Agency, gives detailed data on the distance, motion, brightness and colour of nearly 1.7 billion stars that are floating around us. It was gathered by its Gaia probe between July 2014 and May 2016.
It has already helped unlock some of the universe's mysteries – and scientists expect that it could go on to reveal many more.
Hundreds of scientists and software engineers took years to process the data and create a catalog of stars from which they were able to generate maps, including of the asteroids in our solar system and even a three-dimensional chart of some nearby stars.
Antonella Vallenari, one of the lead scientists involved in the project, said astronomers have gained new insights into the life cycle of stars and how the Milky Way was formed.
One theory supported by the observations is that our galaxy was struck by material from another, resulting in 'ripples' of stars moving in an unexpected way compared with the otherwise uniform motion of stars in the Milky Way, said Vallenari.
ESA said professional and amateur astronomers alike will be able to access the data and hunt for new discoveries. It's the second release following the publication two years ago of a smaller batch of measurements covering 2 million stars.
Further data releases are planned in the coming years.
Additional reporting by agencies
Join our commenting forum
Join thought-provoking conversations, follow other Independent readers and see their replies
Comments